The Big Government Trap: Does Stimulus Require Government Spending to Continuously Rise?
There has been a lot of back and forth over the last few years
about "austerity". I have wondered how government spending levels over
the last few years that dwarf any peacetime levels in history could be
called "austerity", but that is exactly what folks like Paul Krugman
have been doing. Apparently, the new theory is that the level of
spending is irrelevant to stimulus, and only the first derivative
matters. In other words, high spending is not stimulative unless it is
also increasing year by year. Kevin Drum provides an explanation of this position:
I will leave macro theory (of which I am increasingly skeptical) to the Phd's. In this case however, Drum's narrative is undermined by his own chart he published a few weeks ago:
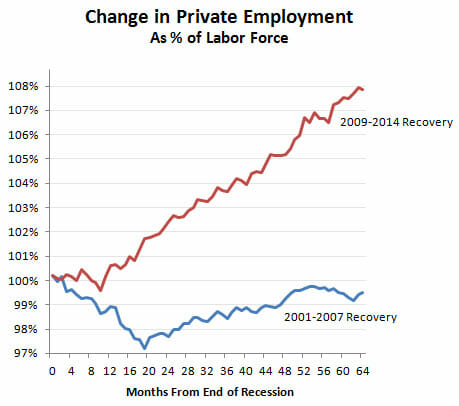
In his recent austerity article quoted above, he describes a sluggish recovery with a step-change in 2014 only after "austerity" ends. But his chart from a few weeks earlier shows a steady recovery from 2010-2014, right through his "austerity" period. In fact, during the Bush recovery he derides, we actually did do exactly what he thinks is stimulative, ie increase government spending per capita steadily year by year. How do we know this? From another Drum chart, this one from last year. I changed the colors (described in this article) and compared his two charts:
By Drum's austerity theory, the Bush spending was stimulative but the Obama spending was austerity. But the chart on the right sure makes it look like the Obama recovery is stronger than the Bush recovery.
A better explanation of the data is that a recession driven by the highly-leveraged mis-allocation of too much capital to home real estate was made worse in 2008-2009 by a massive increase in government spending, which is almost by definition a further mis-allocation of capital (government is taking money from where the private sector thinks it should be invested and moves it to where politicians think it should be spent). The economy has recovered as that increase in government spending has been unwound.
Austerity is all about the trajectory of government spending, and this is what it looks like. You can argue about whether flat spending represents austerity, but a sustained decline counts in anyone's book. The story here is simple: for a little while, in 2009 and 2010, stimulus spending partially offset state and local cuts, but by the end of 2010 the stimulus had run its course. From then on, the drop in government expenditures was steady and significant. It was also unprecedented. If you run this chart back for 50 years you'll never see anything like it. In all previous recessions and their aftermaths, government spending rose.So, by this theory of stimulus, the fact that we spent substantially more money in 2010-2014 than in pre-recession years (and are still spending more money) turns out not to be stimulative. The only way government can stimulate the economy is to increase year-over-year per capital real spending every single year.

I will leave macro theory (of which I am increasingly skeptical) to the Phd's. In this case however, Drum's narrative is undermined by his own chart he published a few weeks ago:
In his recent austerity article quoted above, he describes a sluggish recovery with a step-change in 2014 only after "austerity" ends. But his chart from a few weeks earlier shows a steady recovery from 2010-2014, right through his "austerity" period. In fact, during the Bush recovery he derides, we actually did do exactly what he thinks is stimulative, ie increase government spending per capita steadily year by year. How do we know this? From another Drum chart, this one from last year. I changed the colors (described in this article) and compared his two charts:

By Drum's austerity theory, the Bush spending was stimulative but the Obama spending was austerity. But the chart on the right sure makes it look like the Obama recovery is stronger than the Bush recovery.
A better explanation of the data is that a recession driven by the highly-leveraged mis-allocation of too much capital to home real estate was made worse in 2008-2009 by a massive increase in government spending, which is almost by definition a further mis-allocation of capital (government is taking money from where the private sector thinks it should be invested and moves it to where politicians think it should be spent). The economy has recovered as that increase in government spending has been unwound.
Naomi Oreskes and Post-Modern Science
Post-modernism is many things and its exact meaning is subject
to argument, but I think most would agree that it explicitly rejects
things like formalism and realism in favor of socially constructed
narratives. In that sense, what I mean by "post-modern science" is not
necessarily a rejection of scientific evidence, but a prioritization
where support for the favored narrative is more important than the
details of scientific evidence. We have seen this for quite a while in
climate science, where alarmists, when they talk among themselves,
discuss how it is more important for them to support the narrative
(catastrophic global warming and, tied with this, an increasing strain
of anti-capitalism ala Naomi Klein) than to be true to the facts all the
time. As a result, many climate scientists would argue (and have) that
accurately expressing the uncertainties in their analysis or
documenting counter-veiling evidence is wrong, because it dilutes the
narrative.
I think this is the context in which Naomi Oreskes' recent NY Times article should be read. It is telling she uses the issue of secondhand tobacco smoke as an example, because that is one of the best examples I can think of when we let the narrative and our preferred social policy (e.g. banning smoking) to trump the actual scientific evidence. The work used to justify second hand smoke bans is some of the worst science I can think of, and this is what she is holding up as the example she wants to emulate in climate. I have had arguments on second hand smoke where I point out the weakness and in some cases the absurdity of the evidence. When cornered, defenders of bans will say, "well, its something we should do anyway." That is post-modern science -- narrative over rigid adherence to facts.
I have written before on post-modern science here and here.
If you want post-modern science in a nutshell, think of the term "fake but accurate". It is one of the most post-modern phrases I can imagine. It means that certain data, or an analysis, or experiment was somehow wrong or corrupted or failed typical standards of scientific rigor, but was none-the-less "accurate". How can that be? Because accuracy is not defined as logical conformance to observations. It has been redefined as "consistent with the narrative." She actually argues that our standard of evidence should be reduced for things we already "know". But know do we "know" it if we have not checked the evidence? Because for Oreskes, and probably for an unfortunately large portion of modern academia, we "know" things because they are part of the narrative constructed by these self-same academic elites.
Low Oil Prices and Prosperity
I continue to see reports about how bad falling oil prices are
for the economy -- most recently some layoffs in the steel industry were
blamed on the looming drop (or crash) in oil drilling and exploration
driven by substantially lower prices.
I find this exasperating, a classic seen-and-unseen type failure whose description goes back at least to the mid-19th century and Bastiat and essentially constituted most of Hazlitt's one lesson on economics. Yes, very visibly, relatively high-paid steel and oil workers are going to lose their jobs. They will have less money to spend. The oil industry will have less capital spending.
But the world will pay over a trillion dollars less this year for oil than it did last year (if current prices hold). That is a huge amount of money that can be spent on or invested in something else. Instead of just getting oil with those trillion dollars, we will still have our oil and a trillion dollars left over to spend. We may never know exactly who benefits, but those benefits are definitely there, somewhere. Just because they cannot be seen or portrayed in short visual anecdotes on the network news does not mean they don't exist.
Ugh, this is just beyond frustrating. I would have bet that at least with oil people would have understood the unseen benefit, since we get so much media reportage and general angst when gas prices go up that people would be thrilled at their going down. But I guess not.
I explained in simple terms why the world, mathematically, HAS to be better off with lower oil prices here.
Before Michael Brown, Ferguson Police Did This
I had forgotten about this story and am surprised the media did not make this connection more often during the Michael Brown brouhaha:
Michael Daly at The Daily Beast has the flabbergasting story of Henry Davis, who was picked up by cops “for an outstanding warrant that proved to actually be for another man of the same surname, but a different middle name and Social Security number,” then beaten by several officers at the station. What happened next was truly surreal: while denying that Davis had been seriously hurt at all, though a CAT scan found he had suffered a concussion and a contemporaneous photo shows him bleeding heavily, four police officers sought to have him charged for property damage for getting blood on their uniforms. ...
The kicker: the police department was that of Ferguson, Missouri.
My Contributions to Social Science
It occurred to me that I have reached important insights into
human behavior that it would be negligent of me to withhold from the
world, so here they are:
The Cheerleader Effect: The cheerleader effect describes a human perception issue where pictures of any woman in a group are often considered more attractive than a picture of that woman alone (this may apply to men as well, but I have always heard it referred to women). Apparently women exploit this effect by posting pictures on dating sites that show them in groups of their friends rather than alone. Anyway, I have developed two corollaries:
The Cheerleader Effect: The cheerleader effect describes a human perception issue where pictures of any woman in a group are often considered more attractive than a picture of that woman alone (this may apply to men as well, but I have always heard it referred to women). Apparently women exploit this effect by posting pictures on dating sites that show them in groups of their friends rather than alone. Anyway, I have developed two corollaries:
- Polo Shirt Effect: Polo shirts in a store appear more desirable when grouped with other similar shirts in an array of colors than when presented alone. This effect is strong enough to trump the paradox of choice, where offering consumers more choices can tend to flummox them and cause them to buy less. I believe arrays of multi-hued polo shirts presented together increase purchases of these shirts.
- Christmas Tree Effect: We almost never buy ornaments for our tree. 95% are individually ugly, but meaningful, constructions by our kids over the years. The rest are what remain after breakage of some commercial ornaments we bought 20 years ago on deep discount in the after-Christmas sales. But a tree constructed of these ornaments is beautiful. So ornaments look far better when massed on a tree than they look individually.
- Groups of pedestrians will expand to fill the width of the space allotted. If the width changes, groups of pedestrians will respond very quickly and expand their group spacing to fill that width. While this behavior is almost certainly natural, it is almost impossible to distinguish a group walking naturally from one purposefully trying to block passage by a faster pedestrian. Corollary: Groups too small to fill the width of a passage or sidewalk will weave.
- Groups of pedestrians, everything else being equal, will choose to pause and congregate at the bottleneck in any sidewalk, thus constricting an already narrow passage. DisneyWorld is a great location for spotting this behavior. Corollary: A disproportionate number of people will choose to stop right at the exit door from an jetway when exiting an aircraft.
Explaining the Financial Crisis: Government Creation of a Financial Investment Mono-culture
Arnold Kling on the recent financial crisis:
Well, this obviously created a strong incentive for banks to invest in assets deemed by the government as "safe". Which of course was the whole point -- if we are going to have taxpayer-backed deposit insurance and bank bailouts, the prices of that is getting into banks' shorts about the risks they are taking with their investments. This is the attempted tightening of regulation to which Kling refers. Regulators were trying for tougher, not weaker standards.
But any libertarian could tell you the problem that is coming here -- the regulatory effort was substituting the risk judgement of thousands or millions of people (individual bank and financial investors) for the risk judgement of a few regulators. There is no guarantee, in fact no reason to believe, the judgement of these regulators is any better than the judgement of the banks. Their incentives might be different, but there is also not any guarantee the regulators' incentives are better (the notion they are driven by the "public good" is a cozy myth that never actually occurs in reality).
Anyway, what assets did the regulators choose as "safe"? Again, we will simplify, but basically sovereign debt and mortgages (including the least risky tranches of mortgage-backed debt). So you are a bank president in this new regime. You only have enough capital to meet government requirements if you get 100% credit for your investments, so it must be invested in "safe" assets. What do you tell your investment staff? You tell them to go invest the money in the "safe" asset that has the highest return.
And for most banks, this was mortgage-backed securities. So, using the word Brad DeLong applied to deregulation, there was an "orgy" of buying of mortgage-backed securities. There was simply enormous demand. You hear stories about fraud and people cooking up all kinds of crazy mortgage products and trying to shove as many people as possible into mortgages, and here is one reason -- banks needed these things. For the average investor, most of us stayed out. In the 1980's, mortgage-backed securities were a pretty good investment for individuals looking for a bit more yield, but these changing regulations meant that banks needed these things, so the prices got bid up (and thus yields bid down) until they only made sense for the financial institutions that had to have them.
It was like suddenly passing a law saying that the only food people on government assistance could buy with their food stamps was oranges and orange derivatives (e.g. orange juice). Grocery stores would instantly be out of oranges and orange juice. People around the world would be scrambling to find ways to get more oranges to market. Fortunes would be made by clever people who could find more oranges. Fraud would likely occur as people watered down their orange derivatives or slipped in some Tang. Those of us not on government assistance would stay away from oranges and eat other things, since oranges were now incredibly expensive and would only be bought at their current prices by folks forced to do so. Eventually, things would settle down as everyone who could do so started to grow oranges. And all would be fine again, that is until there was a bad freeze and the orange crop failed.
Government regulation -- completely well-intentioned -- had created a mono-culture. The diversity of investment choices that might be present when every bank was making its own asset risk decisions was replaced by a regime where just a few regulators picked and chose the assets. And like any biological mono-culture, the ecosystem might be stronger for a while if those choices were good ones, but it made the whole system vulnerable to anything that might undermine mortgages. When the housing market got sick (and as Kling says government regulation had some blame there as well), the system was suddenly incredibly vulnerable because it was over-invested in this one type of asset. The US banking industry was a mono-culture through which a new disease ravaged the population.
Postscript: So with this experience in hand, banks moved out of mortage-backed securities and into the last "safe" asset, sovereign debt. And again, bank presidents told their folks to get the best possible yield in "safe" assets. So banks loaded up on sovereign debt, in particular increasing the demand for higher-yield debt from places like, say, Greece. Which helps to explain why the market still keeps buying up PIIGS debt when any rational person would consider these countries close to default. So these countries continue their deficit spending without any market check, because financial institutions keep buying this stuff because it is all they can buy. Which is where we are today, with a new monoculture of government debt, which government officials swear is the last "safe" asset. Stay tuned....
Postscript #2: Every failure and crisis does not have to be due to fraud and/or gross negligence. Certainly we had fraud and gross negligence, both by private and public parties. But I am reminded of a quote which I use all the time but to this day I still do not know if it is real. In the great mini-series "From the Earth to the Moon", the actor playing astronaut Frank Borman says to a Congressional investigation, vis a vis the fatal Apollo 1 fire, that it was "a failure of imagination." Engineers hadn't even considered the possibility of this kind of failure on the ground.
In the same way, for all the regulatory and private foibles associated with the 2008/9 financial crisis, there was also a failure of imagination. There were people who thought housing was a bubble. There were people who thought financial institutions were taking too much risk. There were people who thought mortgage lending standards were too lax. But with few exceptions, nobody from progressive Marxists to libertarian anarcho-capitalists, from regulators to bank risk managers, really believed there was substantial risk in the AAA tranches of mortgage securities. Hopefully we know better now but I doubt it.
Update#1: The LA Times attributes "failure of imagination" as a real quote from Borman. Good, I love that quote. When I was an engineer investigating actual failures of various sorts (in an oil refinery), the vast majority were human errors in procedure or the result of doing things unsafely that we really knew in advance to be unsafe. But the biggest fire we had when I was there was truly a failure of imagination. I won't go into it, but it resulted from a metallurgical failure that in turn resulted form a set of conditions that we never dreamed could have existed.
By the way, this is really off topic, but the current state of tort law has really killed quality safety discussion in companies of just this sort of thing. Every company should be asking itself all the time, "is this unsafe?" or "under what conditions might this be unsafe" or "what might happen if..." Unfortunately, honest discussions of possible safety issues often end up as plaintiff's evidence in trials. The attorney will say "the company KNEW it was unsafe and didn't do anything about it", often distorting what are honest and healthy internal discussions on safety that we should want occurring into evidence of evil malfeasance. So companies now show employees videos like one I remember called, I kid you not, "don't write it down."
1. The facts are that one can just as easily blame the financial crash on an attempted tightening of regulation. That is, in the process of trying to rein in bank risk-taking by adopting risk-based capital regulations, regulators gave preference to highly-rated mortgage-backed securities, which in turn led to the manufacturing of such securities out of sub-prime loans.What he is referring to is a redefinition by governments in the Basel accords of how capital levels at banks should be calculated when determining capital sufficiency. I will oversimplify here, but basically it categorized some assets as "safe" and some as "risky". Those that were risky had their value cut in half for purposes of capital calculations, while those that were "safe" had their value counted at 100%. So if a bank invested a million dollars in safe assets, that would count as a million dollar towards its capital requirements, but would count only $500,000 towards those requirements if it were invested in risky assets. As a result, a bank that needed a billion dollars in capital would need a billion of safe assets or two billion of risky assets.
2. The global imbalances that many of us thought were a bigger risk factor than the housing bubble did not in fact blow up the way that we thought that they would. The housing bubble blew up instead.
Well, this obviously created a strong incentive for banks to invest in assets deemed by the government as "safe". Which of course was the whole point -- if we are going to have taxpayer-backed deposit insurance and bank bailouts, the prices of that is getting into banks' shorts about the risks they are taking with their investments. This is the attempted tightening of regulation to which Kling refers. Regulators were trying for tougher, not weaker standards.
But any libertarian could tell you the problem that is coming here -- the regulatory effort was substituting the risk judgement of thousands or millions of people (individual bank and financial investors) for the risk judgement of a few regulators. There is no guarantee, in fact no reason to believe, the judgement of these regulators is any better than the judgement of the banks. Their incentives might be different, but there is also not any guarantee the regulators' incentives are better (the notion they are driven by the "public good" is a cozy myth that never actually occurs in reality).
Anyway, what assets did the regulators choose as "safe"? Again, we will simplify, but basically sovereign debt and mortgages (including the least risky tranches of mortgage-backed debt). So you are a bank president in this new regime. You only have enough capital to meet government requirements if you get 100% credit for your investments, so it must be invested in "safe" assets. What do you tell your investment staff? You tell them to go invest the money in the "safe" asset that has the highest return.
And for most banks, this was mortgage-backed securities. So, using the word Brad DeLong applied to deregulation, there was an "orgy" of buying of mortgage-backed securities. There was simply enormous demand. You hear stories about fraud and people cooking up all kinds of crazy mortgage products and trying to shove as many people as possible into mortgages, and here is one reason -- banks needed these things. For the average investor, most of us stayed out. In the 1980's, mortgage-backed securities were a pretty good investment for individuals looking for a bit more yield, but these changing regulations meant that banks needed these things, so the prices got bid up (and thus yields bid down) until they only made sense for the financial institutions that had to have them.
It was like suddenly passing a law saying that the only food people on government assistance could buy with their food stamps was oranges and orange derivatives (e.g. orange juice). Grocery stores would instantly be out of oranges and orange juice. People around the world would be scrambling to find ways to get more oranges to market. Fortunes would be made by clever people who could find more oranges. Fraud would likely occur as people watered down their orange derivatives or slipped in some Tang. Those of us not on government assistance would stay away from oranges and eat other things, since oranges were now incredibly expensive and would only be bought at their current prices by folks forced to do so. Eventually, things would settle down as everyone who could do so started to grow oranges. And all would be fine again, that is until there was a bad freeze and the orange crop failed.
Government regulation -- completely well-intentioned -- had created a mono-culture. The diversity of investment choices that might be present when every bank was making its own asset risk decisions was replaced by a regime where just a few regulators picked and chose the assets. And like any biological mono-culture, the ecosystem might be stronger for a while if those choices were good ones, but it made the whole system vulnerable to anything that might undermine mortgages. When the housing market got sick (and as Kling says government regulation had some blame there as well), the system was suddenly incredibly vulnerable because it was over-invested in this one type of asset. The US banking industry was a mono-culture through which a new disease ravaged the population.
Postscript: So with this experience in hand, banks moved out of mortage-backed securities and into the last "safe" asset, sovereign debt. And again, bank presidents told their folks to get the best possible yield in "safe" assets. So banks loaded up on sovereign debt, in particular increasing the demand for higher-yield debt from places like, say, Greece. Which helps to explain why the market still keeps buying up PIIGS debt when any rational person would consider these countries close to default. So these countries continue their deficit spending without any market check, because financial institutions keep buying this stuff because it is all they can buy. Which is where we are today, with a new monoculture of government debt, which government officials swear is the last "safe" asset. Stay tuned....
Postscript #2: Every failure and crisis does not have to be due to fraud and/or gross negligence. Certainly we had fraud and gross negligence, both by private and public parties. But I am reminded of a quote which I use all the time but to this day I still do not know if it is real. In the great mini-series "From the Earth to the Moon", the actor playing astronaut Frank Borman says to a Congressional investigation, vis a vis the fatal Apollo 1 fire, that it was "a failure of imagination." Engineers hadn't even considered the possibility of this kind of failure on the ground.
In the same way, for all the regulatory and private foibles associated with the 2008/9 financial crisis, there was also a failure of imagination. There were people who thought housing was a bubble. There were people who thought financial institutions were taking too much risk. There were people who thought mortgage lending standards were too lax. But with few exceptions, nobody from progressive Marxists to libertarian anarcho-capitalists, from regulators to bank risk managers, really believed there was substantial risk in the AAA tranches of mortgage securities. Hopefully we know better now but I doubt it.
Update#1: The LA Times attributes "failure of imagination" as a real quote from Borman. Good, I love that quote. When I was an engineer investigating actual failures of various sorts (in an oil refinery), the vast majority were human errors in procedure or the result of doing things unsafely that we really knew in advance to be unsafe. But the biggest fire we had when I was there was truly a failure of imagination. I won't go into it, but it resulted from a metallurgical failure that in turn resulted form a set of conditions that we never dreamed could have existed.
By the way, this is really off topic, but the current state of tort law has really killed quality safety discussion in companies of just this sort of thing. Every company should be asking itself all the time, "is this unsafe?" or "under what conditions might this be unsafe" or "what might happen if..." Unfortunately, honest discussions of possible safety issues often end up as plaintiff's evidence in trials. The attorney will say "the company KNEW it was unsafe and didn't do anything about it", often distorting what are honest and healthy internal discussions on safety that we should want occurring into evidence of evil malfeasance. So companies now show employees videos like one I remember called, I kid you not, "don't write it down."
I Believe the Trend Was Caused by All the Things I Believed Before I Investigated the Trend
This is so common that there ought to be a name for it (perhaps
there is and I just don't know it): Writer does a story or study on
some trend, in this case the downfall of the enclosed shopping mall.
In each case, the writer discovers that such malls died because of ...
all the things the writer already holds dear. If the writer hates
American consumerism, then the fall of such malls is a backlash against
American consumerism.
It is interesting to note that all of the ideas quoted are demand-side explanations, e.g. why might consumers stop going to large enclosed malls. And certainly I find the newer outdoor malls more congenial personally, but this can't be the only explanation. Here in north Phoenix, I can see the dying enclosed Paradise Valley Mall out my window, but just a few miles away is the Scottsdale Fashion Square, a traditional mall that appears to be going great guns. Ditto the Galleria in Houston. Perhaps part of the answer is that enclosed malls were simply overbuilt and that people are willing to drive a bit to get to the best enclosed mall in town rather than a smaller version closer to their home (certainly Mall of America made a big bet on that effect).
But it also strikes me there are supply side considerations. The mall out my window is a huge waste of space, surrounded by parking lots the size of a small county. And it's just retail. Modern outdoor malls allow developers to mix shopping, living, and office space in what looks to my eye to be a much denser development. All these malls have stores on the ground floor with condos and offices up above. To my not-real-estate-trained eye, this would seem to increase the potential rents in a given piece of land and provide some synergies among the local businesses (e.g. office workers and residents eat and shop in the mall shops). In some sense it is a re-imagining of the downtown urban space in a suburban context. This is ironic because it is something urban planners have been trying to force for decades and here comes the free market to do it on its own.
People also like going to newer facilities. Just ask hotel owners. If owners do not totally refresh a hotel every 20 years or so, people stop visiting and rates fall. The same is true of gas stations and convenience stores. When I worked at Exxon briefly, they said they budgeted to totally rebuild a gas station every 20 years. So it is not impossible there is a big supply-side explanation here -- if people are reluctant to go to establishments over 20 years old, then visitation of enclosed malls should be collapsing right about now, 20 years after they stopped being built. A shift in developer preferences could be a large element driving this behavior. I don't insist that the supply side and real estate incentives are the only explanation, but I think they are a part of it.
Geeky Reflections -- Simulated Annealing
When I was an undergrad, my interest was in interfacing
microcomputers with mechanical devices. Most of what we did would be
labelled "robotics" today, or at least proto-robotics (e.g. ripping the
ultrasonic rangefinder out of a Polaroid camera, putting it on a stepper
motor, and trying to paint a radar image of the room on a computer
screen).
In doing this, we were playing around with S-100 bus computers (PC's were a bit in the future at that point) and I got interested in brute force approaches to solving the traveling salesman problem. The way this is done is to establish some random points in x,y space and then connect them with a random path and measure the length of that path. The initial random path is obviously going to be a terrible solution. So you have the computer randomly flip flop two segments, and then you see if the resulting total distance is reduced. If it is, then you keep the change and try another.
This will lead to a much shorter path, but often will not lead to the optimally shortest path. The reason is that the result can get stuck in a local minimum that is not the optimum. Essentially, to break out of this, you have to allow the solution to get worse first before it can get better.
The approach I was playing with was called simulated annealing. Everything I said above is the same in this approach, but sometimes you let the program accept flip-flopped segments that yield a worse (ie longer) rather than better path. The allowed amount worse is governed by a "temperature" that is slowly lowered. Initially, at high temperatures, the solution can jump into most any solution, better or worse. But as the "temperature" is lowered, the allowed amount of jumping into worse solutions is reduced. Essentially, the system is much, much more likely than the previous approach to settle closer to the actual optimum. This is roughly an analog of how annealing works in metals. The code is ridiculously simple. I don't remember it being much more than 100 lines in Pascal.
Anyway, if you lived through the above without falling asleep, the payoff is this site. After 30 years of pretty much never thinking about simulated annealing again, I found Todd Schneider's blog which has a great visual overview of solving the travelling salesman problem with simulated annealing. If you really want to visually see it work, go to the customizable examples at the bottom and set the iterations per map draw for about 100. Then watch. It really does look a bit like a large excited molecule slowly cooling. Here is an example below but check out his site.
Thanks for the Support of My Writing
Thanks mostly to y'all, my short story String Theory
still sits in the top 25 (well, it is at exactly 25) of the Amazon
Kindle science fiction and short story rankings. One notch above John
Scalzi, and just two notches below David Brin. And one of the only
entries at the top of the list that does not have a guy with ripped abs
or two vampires making out on the cover. Pretty cool.
And The Highest-Paid US Government Employee is....
...Probably Nick Saban, coach of the University of Alabama football team at around $7 million a year. But Jim Harbaugh,
recently hired by the University of Michigan for a $5 million base
salary, apparently has incentives that can take that up to $9 million a
year.
Apologists will argue that this is all OK and shouldn't worry taxpayers at all because these guys are paid out of the college athletic budget which is generated from sports revenue rather than taxes. Hmm. Any state parks agency probably generates millions or tens of millions each year in user fees. Should we be OK with the state employee who runs those agencies making $5 million because it comes out of user fees rather than taxes? Money is fungible. $5 million more spent on a football coach is $5 million less that can fund other University services.
(PS - in the US Today ranking of college football coach salaries, 19 of 20 are at public institutions).
What is Normal?
I titled my very first climate video "What is Normal," alluding
to the fact that climate doomsayers argue that we have shifted aspects
of the climate (temperature, hurricanes, etc.) from "normal" without us
even having enough historical perspective to say what "normal" is.
A more sophisticated way to restate this same point would be to say that natural phenomenon tend to show various periodicities, and without observing nature through the whole of these cycles, it is easy to mistake short term cyclical variations for long-term trends.
A paper in the journal Water Resources Research makes just this point using over 200 years of precipitation data:
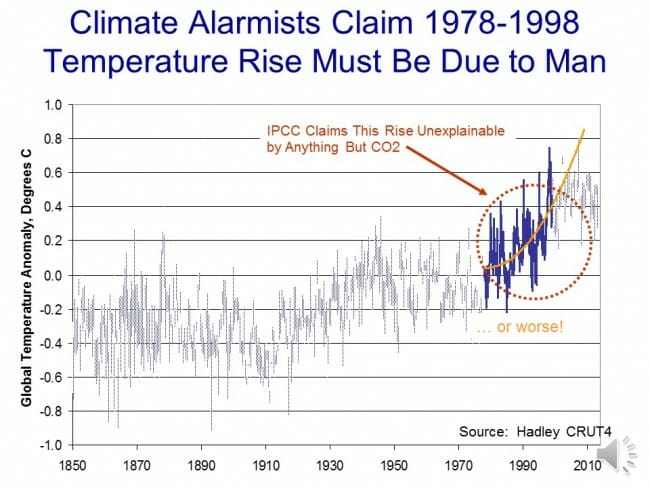
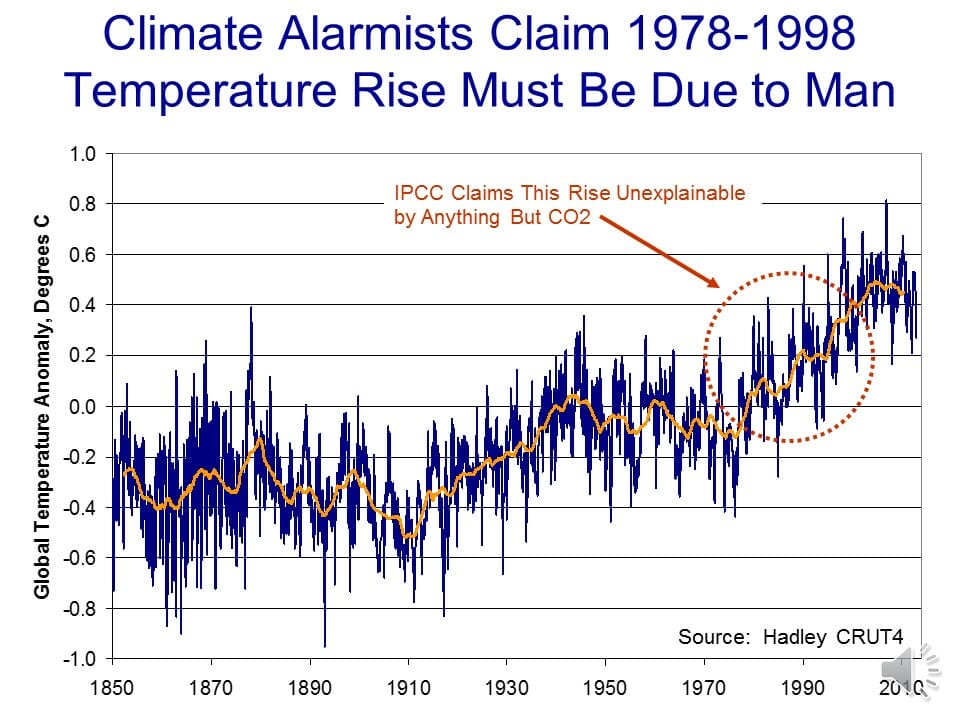
A good example of why this is relevant is the global temperature trend. This chart is a year or so old and has not been updated in that time, but it shows the global temperature trend using the most popular surface temperature data set. The global warming movement really got fired up around 1998, at the end of the twenty year temperature trend circled in red.
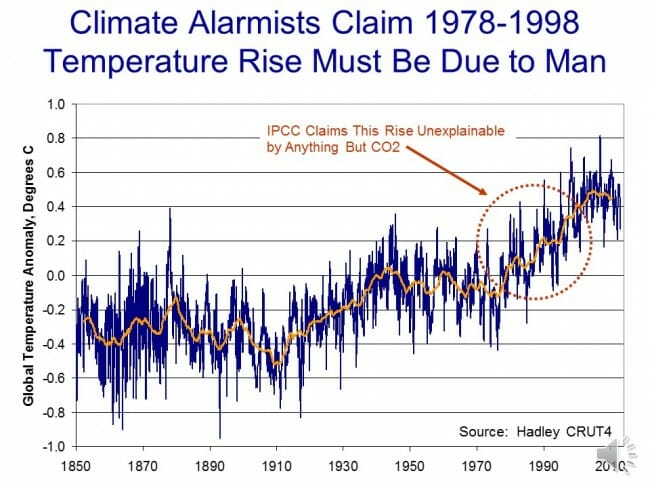
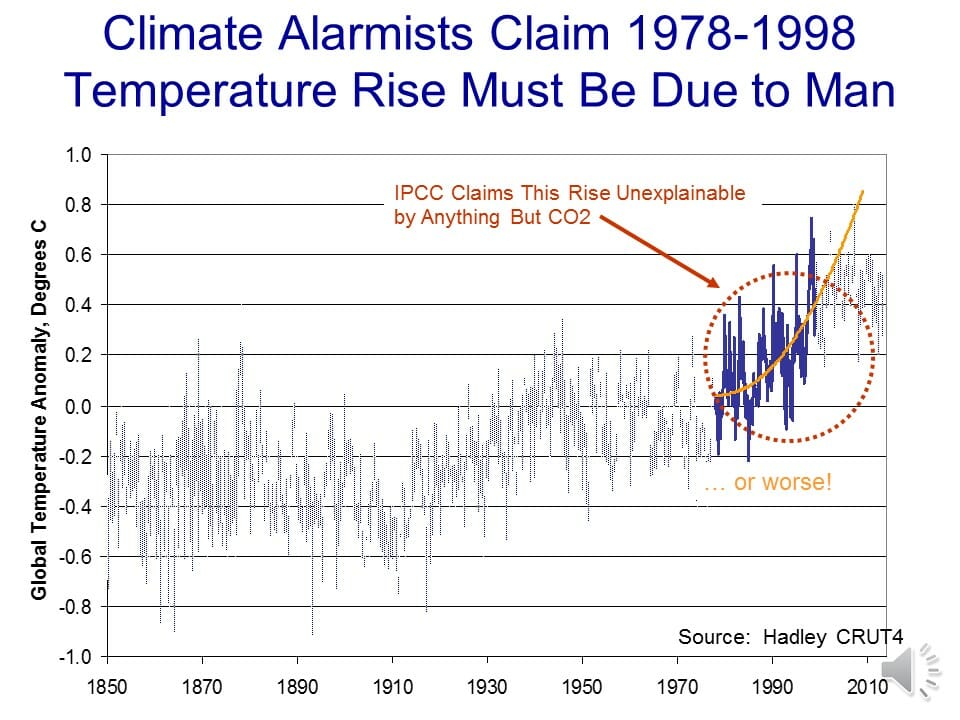
They then took the trends from these 20 years and extrapolated them into the future:
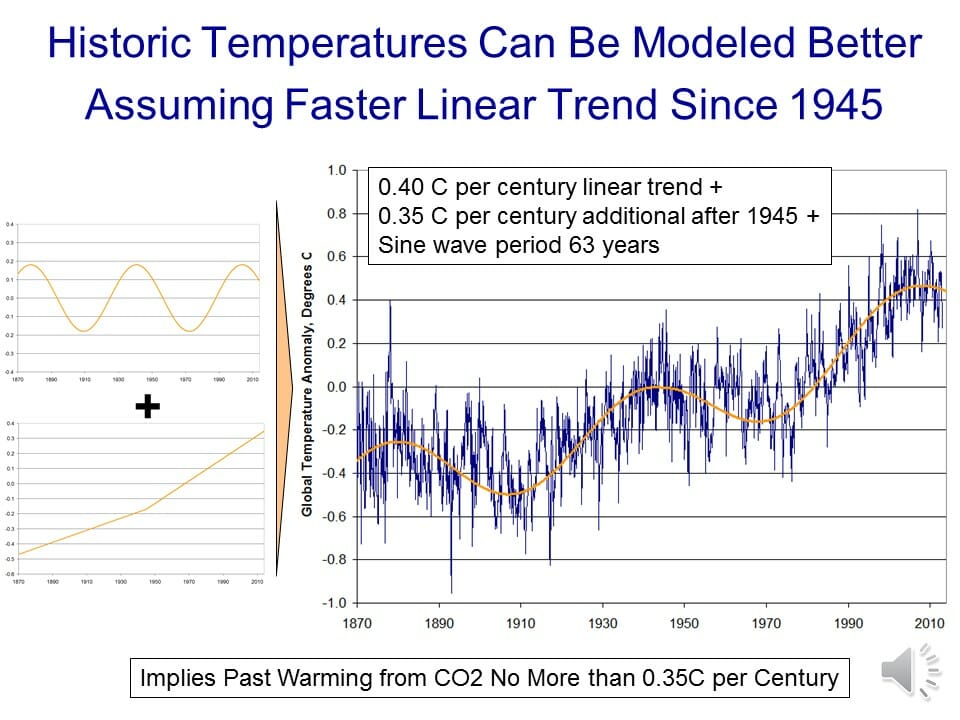
But what if that 20 years was merely the upward leg of a 40-60 year cyclic variation? Ignoring the cyclic functions would cause one to overestimate the long term trend. This is exactly what climate models do, ignoring important cyclic functions like the AMO and PDO.
In fact, you can get a very good fit with actual temperature by modeling them as three functions: A 63-year sine wave, a 0.4C per century long-term linear trend (e.g. recovery from the little ice age) and a new trend starting in 1945 of an additional 0.35C, possibly from manmade CO2.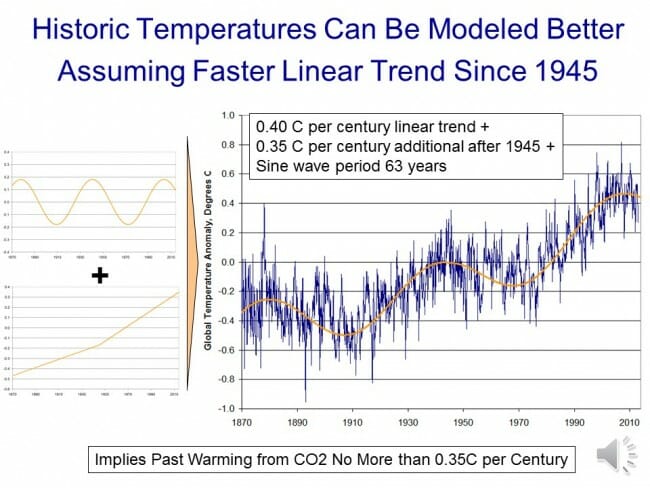
In this case, a long-term trend still appears to exist but it is exaggerated by only trying to measure it in the upward part of the cycle (e.g. from 1978-1998).
A more sophisticated way to restate this same point would be to say that natural phenomenon tend to show various periodicities, and without observing nature through the whole of these cycles, it is easy to mistake short term cyclical variations for long-term trends.
A paper in the journal Water Resources Research makes just this point using over 200 years of precipitation data:
We analyze long-term fluctuations of rainfall extremes in 268 years of daily observations (Padova, Italy, 1725-2006), to our knowledge the longest existing instrumental time series of its kind. We identify multidecadal oscillations in extremes estimated by fitting the GEV distribution, with approximate periodicities of about 17-21 years, 30-38 years, 49-68 years, 85-94 years, and 145-172 years. The amplitudes of these oscillations far exceed the changes associated with the observed trend in intensity. This finding implies that, even if climatic trends are absent or negligible, rainfall and its extremes exhibit an apparent non-stationarity if analyzed over time intervals shorter than the longest periodicity in the data (about 170 years for the case analyzed here). These results suggest that, because long-term periodicities may likely be present elsewhere, in the absence of observational time series with length comparable to such periodicities (possibly exceeding one century), past observations cannot be considered to be representative of future extremes. We also find that observed fluctuations in extreme events in Padova are linked to the North Atlantic Oscillation: increases in the NAO Index are on average associated with an intensification of daily extreme rainfall events. This link with the NAO global pattern is highly suggestive of implications of general relevance: long-term fluctuations in rainfall extremes connected with large-scale oscillating atmospheric patterns are likely to be widely present, and undermine the very basic idea of using a single stationary distribution to infer future extremes from past observations.Trying to work with data series that are too short is simply a fact of life -- everyone in climate would love a 1000-year detailed data set, but we don't have it. We use what we have, but it is important to understand the limitations. There is less excuse for the media that likes to use single data points, e.g. one storm, to "prove" long term climate trends.
A good example of why this is relevant is the global temperature trend. This chart is a year or so old and has not been updated in that time, but it shows the global temperature trend using the most popular surface temperature data set. The global warming movement really got fired up around 1998, at the end of the twenty year temperature trend circled in red.
They then took the trends from these 20 years and extrapolated them into the future:
But what if that 20 years was merely the upward leg of a 40-60 year cyclic variation? Ignoring the cyclic functions would cause one to overestimate the long term trend. This is exactly what climate models do, ignoring important cyclic functions like the AMO and PDO.
In fact, you can get a very good fit with actual temperature by modeling them as three functions: A 63-year sine wave, a 0.4C per century long-term linear trend (e.g. recovery from the little ice age) and a new trend starting in 1945 of an additional 0.35C, possibly from manmade CO2.
In this case, a long-term trend still appears to exist but it is exaggerated by only trying to measure it in the upward part of the cycle (e.g. from 1978-1998).
No comments:
Post a Comment